- Summary
- Modeling block relationships
- Interpolation model
- Lower and upper bounds
- Footnotes
- References
Summary
In time series tables that are standardized to 2010 census geography, NHGIS produces 1990 statistics by reaggregating census block data from 1990 Census Summary Tape File 1 (NHGIS dataset 1990_STF1).
NHGIS first allocates census counts from 1990 blocks to 2010 blocks and then sums the reallocated counts for all 2010 blocks that lie within each target 2010 unit. In cases where a 1990 block may intersect multiple 2010 blocks, NHGIS applies interpolation to estimate how 1990 block characteristics are distributed among the intersecting 2010 blocks, primarily using the population and housing densities of 2000 and 2010 blocks to model the distribution of 1990 characteristics within 1990 blocks.
Boundary data for 1990, 2000 and 2010 blocks vary in quality, making it impossible to determine exact relationships between 1990 and 2010 block boundaries. NHGIS uses a combination of direct and indirect overlay of block boundaries, constrained to avoid invalid intersections and balanced to employ the most suitable strategy depending on the degree of boundary mismatch.
Modeling block relationships
Problem: Inconsistent representations
A major complication for 1990-to-2010 block interpolation is that there exists no data defining the exact spatial relationships between 1990 and 2010 blocks.
The Census Bureau provides relationship files that give correspondences between 1990 and 2000 blocks and between 2000 and 2010 blocks but not between 1990 and 2010 blocks, and the 1990-to-2000 relationship file provides no information about the sizes of intersections between blocks.
More helpfully, the Census's 2000 TIGER/Line files provide both 1990 and 2000 block boundary definitions, and the 2010 TIGER/Line files provide both 2000 and 2010 block boundaries, making it possible to delineate areas of intersection among blocks for consecutive censuses. (Our interpolation model uses NHGIS block boundary files, which were derived from these TIGER/Line sources.)
No single TIGER/Line release includes both 1990 and 2010 block boundaries, and because the Census Bureau revises feature representations between TIGER/Line releases, it is impossible to determine the exact spatial relationships between many 1990 and 2010 blocks. An exacerbating factor is that between the release of 2000 and 2010 TIGER/Line files, the Census Bureau undertook a major accuracy improvement project that resulted in significant revisions to TIGER/Line feature representations throughout the country. As a result, there are millions of cases where no real change occurred in block boundaries between 1990 and 2010, but the representations of the boundaries still differ between the two TIGER/Line sources (Figure 1a).
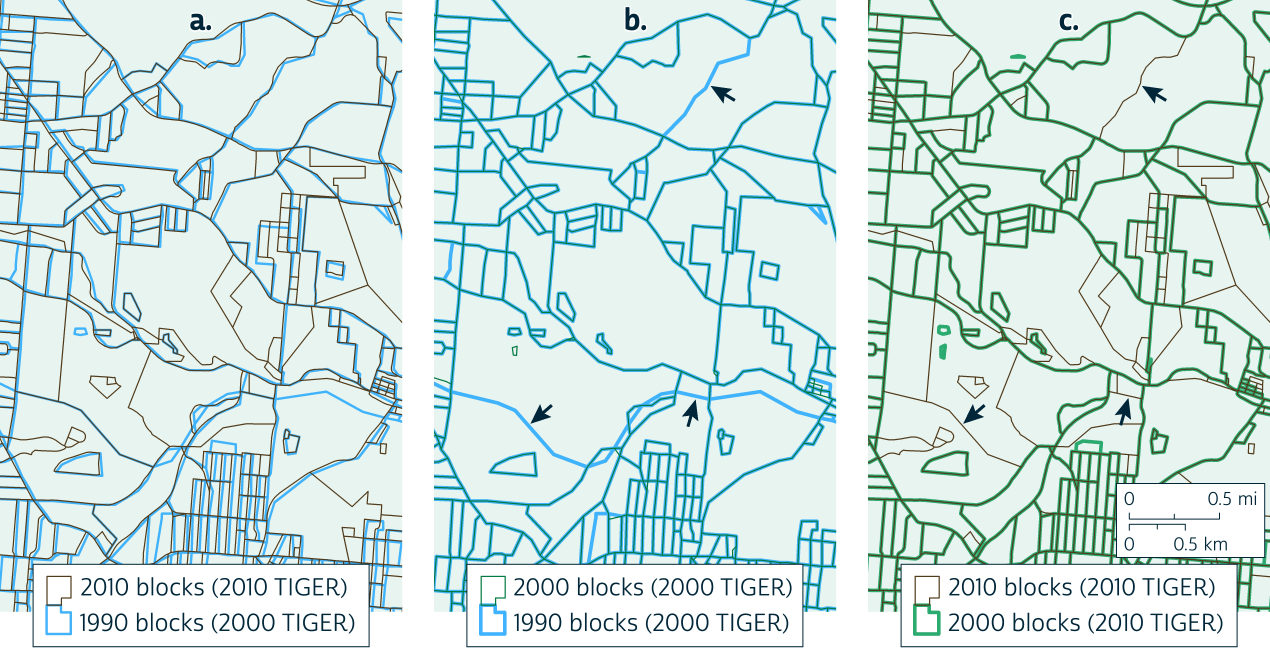
Figure 1. Inconsistent representations of block boundaries in Cincinnati, Ohio. Click for larger version
Solution options
We identify five options for modeling spatial relationships between 1990 and 2010 blocks. Our chosen solution is to combine Options 3 and 4 (indirect overlay and constrained direct overlay) through an approach we term "balanced overlay" (Option 5).
-
Direct overlay of polygons from the 2000 and 2010 TIGER/Line files:
This approach is the simplest option but would yield millions of invalid relationships: cases where the overlay indicates an overlap between 1990 and 2010 blocks due only to changes in TIGER/Line boundary representations. In Figure 1a, many blue 1990 boundaries clearly correspond to brown 2010 boundaries, but the boundaries are variously offset, sometimes by a large amount. An interpolation model based on these relationships would frequently allocate a 1990 block's counts to 2010 blocks that do not in reality overlap the source block.
-
Conflation (i.e., re-alignment) of 1990 boundaries to correspond properly to 2010 TIGER/Line features:
In most cases in Figure 1a, it is easy to see how the misaligned boundaries should agree. An obvious solution, therefore, is to revise the 1990 boundaries to achieve what the human eye does so easily: matching each 1990 boundary with its corresponding 2010 boundary (wherever matches exist). Unfortunately, although there are simple ways to correct systematic misalignments (e.g., uniform displacement having a consistent direction and distance), there remains, to our knowledge, no reliable automated means of eliminating massive numbers of idiosyncratic displacements, and most of the millions of differences between TIGER/Line versions are somehow idiosyncratic. We may reconsider using this approach if we someday find or develop a cost-effective means of reliably conflating all 1990 blocks for the entire U.S.
-
Indirect overlay (IO), determining relationships between 1990 and 2010 blocks via their relationships to 2000 blocks in separate TIGER/Line sources:
This approach involves three operations:
- Overlay 1990 and 2000 block polygons from 2000 TIGER/Line (Figure 1b)
- Overlay 2000 and 2010 block polygons from 2010 TIGER/Line (Figure 1c)
- To estimate the proportion of each 1990 block within each 2010 block, multiply 1990-2000 intersection proportions from step A with 2000-2010 proportions from step B, and sum the resulting products for each pair of 1990 and 2010 blocks
IO performs well for the simple, common case where a single block in all three census years covers the same real extent. E.g., if a 1990 block matches a 2000 block in 2000 TIGER/Line data, and the corresponding 2000 block matches a 2010 block in 2010 TIGER/Line data, then IO will correctly determine that the 1990 block matches the 2010 block.
IO is also effective wherever a 2000 block intersects exactly one 1990 block or exactly one 2010 block. For example, if 2000 TIGER/Line data show that a 2000 block corresponds to part of exactly one 1990 block, and in 2010 TIGER/Line data, the 2000 block is subdivided among 2010 blocks, we can be confident that the part of the 1990 block lying in the 2000 block is also subdivided among the same 2010 blocks. Conversely, if 2000 TIGER/Line data show that a 2000 block shares area with multiple 1990 blocks, but in 2010 TIGER/Line data, the 2000 block corresponds to only one 2010 block, then we can be confident that each of the 1990 blocks intersecting the 2000 block also intersect that 2010 block.1
The problem with IO arises when a 2000 block intersects multiple 1990 blocks and multiple 2010 blocks. (See examples marked by arrows in Figure 1.) In such cases, IO essentially aggregates 1990 block data up to a larger 2000 block area and then disaggregates back down to smaller 2010 blocks, taking no account of correspondences among 1990 and 2010 blocks within the 2000 block.
In the case marked at the top of Figure 1 (b and c), a pair of 1990 blocks and a pair of 2010 blocks both correspond to one 2000 block. IO would suggest that each of the two 1990 blocks intersect both of the 2010 blocks in roughly equal proportion. If one of the 1990 blocks contains a large population and the other contains none, then IO could yield significant errors by allocating population to both of the 2010 blocks, rather than allocating only to the one 2010 block that corresponds to the populated 1990 block.
In each of the two other marked cases in Figure 1, a 2000 block corresponds to several 1990 and 2010 blocks. The basic problem remains: IO does not accurately capture any of the relationships among 1990 and 2010 blocks within each 2000 block.
-
Constrained direct overlay (CDO), applying direct overlay of 2000 and 2010 TIGER/Line data, restricted to areas that lie within the same 2000 block in both TIGER/Line sources:
This approach involves two operations:
- Overlay 1990 and 2000 block polygons from 2000 TIGER/Line with 2000 and 2010 block polygons from 2010 TIGER/Line
- Identify "invalid intersections" where the 2000 block IDs from 2000 and 2010 TIGER/Line do not match, and omit these intersections from all area computations
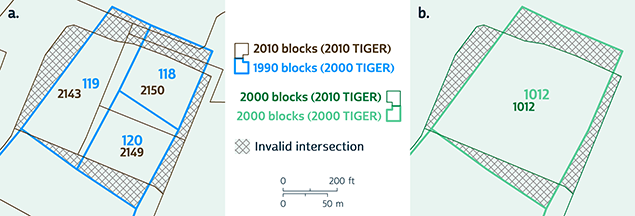
Figure 2. Constrained direct overlay
For example, in Figure 2, the 2000 TIGER/Line data indicates that a 2000 block (1012) corresponds to exactly three 1990 blocks (118, 119, 120), and the 2010 TIGER/Line data indicates that the same 2000 block corresponds to exactly three 2010 blocks (2143, 2149, 2150). It follows that 1990 blocks 118, 119, and 120 should not intersect any 2010 blocks other than 2143, 2149, and 2150, and vice versa.
Simple direct overlay (Option 1) would ignore this constraint, yielding several erroneous intersections (hashed regions in Figure 2a). IO (Option 3) would properly impose this constraint, but it would take no account of the arrangement of the 1990 and 2010 blocks within the 2000 block.
By combining information from direct and indirect overlay, CDO eliminates invalid intersections and identifies correspondences between 1990 and 2010 blocks within 2000 blocks. CDO still yields some errors, as in Figure 2 where some of the direct intersections within the 2000 block appear to be false, but despite these errors, CDO does correctly identify the three main correspondences in Figure 2: 118 to 2150, 119 to 2143, 120 to 2149.
CDO should generally perform well where the discrepancies between 2000 and 2010 TIGER/Line positions are small or moderate, as in Figures 1 and 2, but in some areas, the TIGER/Line discrepancies are so large that even constrained direct overlay is problematic.
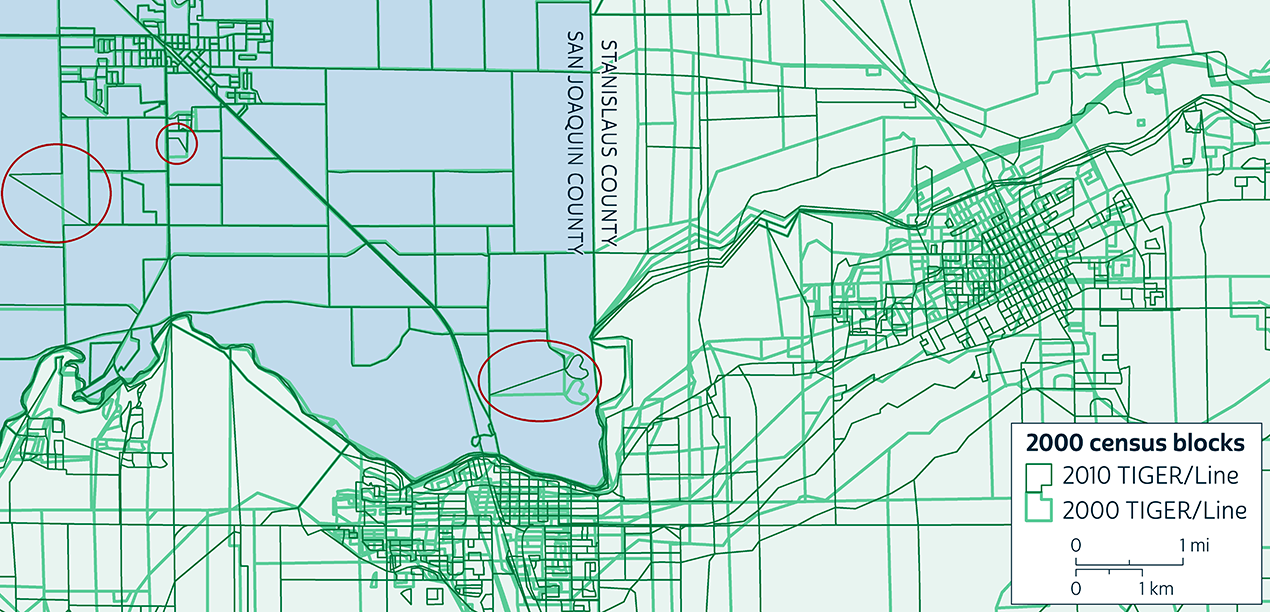
Figure 3. Extreme discrepancies in census block representations in California. Click for larger version
Figure 3 illustrates two types of large discrepancies. First, there are idiosyncratic displacements (circled) in San Joaquin County, where a few 2010 TIGER/Line boundaries diverge sharply from 2000 TIGER/Line positions even though the two sources diverge only slightly throughout most of the county. Second, there are systematic displacements in Stanislaus County, where the 2000 TIGER/Line boundaries are universally displaced by hundreds of meters to the west or northwest of their more accurate 2010 TIGER/Line positions.
If the two TIGER/Line representations of a single 2000 block diverge so much that no part of the two representations overlap—a circumstance occurring in both of the counties in Figure 3 and also not uncommon elsewhere in the country—then CDO is not even applicable because there are no "valid intersections" between 1990 and 2010 blocks within the 2000 block. And even where a 2000 block's representations do intersect, if the intersection covers only a small portion of either of the representations, it indicates significant misalignment between the two sources, in which case, CDO could produce very poor 1990-2010 block correspondences within the problem block.
-
Balanced overlay, combining IO and CDO in varying degrees according to the degree of mismatch among blocks:
This is the approach NHGIS uses for its interpolation from 1990 to 2010 blocks.
The aim of "balanced overlay" is to take advantage of both IO and CDO by blending their results through a context-dependent weighted average, giving all of the weight to IO results where necessary (where CDO is not applicable) and otherwise giving greater weight to CDO according to its suitability, as determined by two factors:
- α (alpha): The proportion of a 2000 block covered by its intersection with a 1990 or 2010 block
- If α is small, then the 2000 block is much larger than a source or target block, so IO is likely to produce inaccurate correspondences for these blocks, and CDO is preferable
- If α is large, then the 2000 block is mainly covered by a single source or target block, and either CDO or IO may be suitable
- If α equals 1, then the 2000 block is fully covered by a single source or target block, so CDO offers no advantage, and IO is preferable
- β (beta): The proportion of a 2000 block's intersection with a 1990 or 2010 block that is "valid" (within both the 2000 and 2010 TIGER/Line representations of the 2000 block)
- If β is large, then the discrepancy between 2000 and 2010 TIGER/Line 2000 boundaries is likely small, and CDO is likely to perform well
- If β is small, then there is a large discrepancy between 2000 and 2010 TIGER/Line boundaries, and CDO is questionable
- If β equals 0, then there is no valid intersection between 2000 and 2010 TIGER/Line polygons, so CDO is not applicable, and IO must be used
Both factors can be measured for 1990-2000 block relationships (α1 and β1) and for 2000-2010 block relationships (α2 and β2). We compute all four measures, and integrate them into a weighted average of IO and CDO results as specified below.
- α (alpha): The proportion of a 2000 block covered by its intersection with a 1990 or 2010 block
Interpolation model
General approach: Cascading density weighting
The general interpolation approach is cascading density weighting (CDW). In CDW, the target year's densities guide the interpolation of the preceding year's densities, which in turn guide the interpolation of the next preceding year's densities, and so on2.
CDW interpolation from 1990 blocks to 2010 units has 3 main steps:
- Use 2010 block densities to guide the allocation of 2000 counts among 2000-2010 block intersections
- Use the estimated 2000 densities to guide the allocation of 1990 counts among 1990-2000-2010 block intersections
- Sum the allocated 1990 counts within each target 2010 unit to produce final estimates
For the first step, we use the same interpolation model that we use to produce block-based 2000 data standardized to 2010 geography. This model primarily uses 2010 block population and housing densities to guide interpolation, but for any inhabited 2000 block that is split by target 2010 units, the model also makes use of 2001 land cover and 2010 road data to refine the modeled distribution.
For the second step, we use no additional land cover or road data to refine the model. In this regard, the model for 1990 interpolation is simpler than the model for 2000 interpolation. It would be possible to integrate land cover or road data from circa 1990 to improve the model, but evidence from an assessment of NHGIS's 2000 model (Schroeder 2017) indicates that applying this kind of "dasymetric refinement" to a density-weighting approach for block interpolation offers relatively small advantages compared to using simpler total-land-area density-weighting. By using the hybrid 2000-2010 interpolation model in Step 1 of the 1990 CDW model, some dasymetric refinement is still employed, though it uses 2001 land cover and 2010 road data, and it is limited to cases where an inhabited 2000 block is split by target 2010 units.
Specification: Interpolation via balanced overlay
Our execution of CDW uses the following sequence of operations:
- Georectify Hawaii's 2000 TIGER/Line polygons to 2010 TIGER/Line features in order to accommodate a systematic change in the coordinate system used to represent Hawaii features between the two TIGER/Line versions.
- In this one instance, our model entails some degree of "conflation".
- Separately apply IO (indirect overlay) and CDO (constrained direct overlay) to estimate z00, the sum of 2000 population and housing units3, for each 1990-2000-2010 block intersection, refining the IO and CDO operations by using the NHGIS hybrid model for 2000-2010 block interpolation rather than simple area weighting alone:
- IO(z00) =
(2000 block population + housing units) *
(expected proportion of 2000 block count in 2010 block, from NHGIS 2000-to-2010 block crosswalk) *
(proportion of 2000 block's area4 in 1990 block, from 2000 TIGER/Line files) - CDO(z00) =
(2000 block population + housing units) *
(expected proportion of 2000 block count in 2010 block, from NHGIS 2000-to-2010 block crosswalk) *
(proportion of 2000-2010 block intersection's "valid" area—the area4 within both 2000 and 2010 TIGER/Line representations of the 2000 block—that intersects 1990-2000 block intersection's area)
- IO(z00) =
- If there is no valid intersection between the 2010 TIGER/Line 2000-2010 block intersection and the 2000 TIGER/Line 2000 block polygon, then the CDO(z00) estimates within the 2000-2010 block intersection are arbitrarily set to zero with no effect on final estimates, as the balancing equation in Step 5 will assign all weight in this area to the IO estimates.
- For each 1990-2000-2010 block intersection, compute four measures of block area mismatch (α1, α2, β1, and β2) indicating relative suitability of IO and CDO
- Compute geometric means of α measures and β measures to produce single score for each factor:
- α = (α1α2)1/2
- α is large only where both the 1990 block and 2010 block comprise a large portion of the 2000 block
- α is small if either the 1990 block or 2010 block comprise a small portion of the 2000 block
- β = (β1β2)1/2
- β is large only if the 2000 block's intersections with both the 1990 block and 2010 block lie mainly within the 2000 block's valid area (the area lying in both the 2000 and 2010 TIGER/Line representations of the 2000 block)
- β is small if the 2000 block's intersections with either the 1990 block or 2010 block lie mainly outside of the 2000 block's valid area
- β is zero if the 2000 block's intersections with either the 1990 block or 2010 block lie entirely outside of the 2000 block's valid area
- α = (α1α2)1/2
- Combine mismatch factor scores into single indicator of suitability of CDO relative to IO:
- wCDO = (1 - α12)βα
- wCDO is generally large where α is small or β is large
- wCDO is small where α is large and β is small
- wCDO is zero where α is one or β is zero
- wCDO = (1 - α12)βα
- Produce final estimate of z00 for each 1990-2000-2010 block intersection through balanced overlay (BO), combining the IO and CDO estimates through a context-dependent weighted average:
- BO(z00) = wCDO*CDO(z00) + (1 - wCDO)*IO(z00)
- Sum BO(z00) for each 1990 block
- Estimate the proportion of each 1990 block's population and housing in each 1990-2000-2010 block intersection as:5
- ([BO(z00) for the intersection] / [sum of BO(z00) for the 1990 block]
- Use the estimated proportions to allocate 1990 block counts to 2010 blocks
- Sum the estimated 1990 counts within each target 2010 unit to produce final estimates for NHGIS time series
A file containing the final interpolation weights (the estimated proportion of each 1990 block's characteristics lying in each 2010 block) is available through the NHGIS Geographic Crosswalks page.
Lower and upper bounds
In NHGIS time series standardized to 2010 geography, the lower and upper bounds on 1990 estimates are based on IO (indirect overlay) alone. In effect, the assumption is that, given all of the 2000 blocks with which a 1990 block shares area6 (according to 2000 TIGER/Line data), if there is more than one 2010 block that also shares area with any of those 2000 blocks (according to 2010 TIGER/Line data), then it is possible that either all or none of the 1990 block's characteristics were located in any one of the "indirectly" associated 2010 blocks (regardless of whether the 1990 and 2010 blocks intersect via direct overlay).
Footnotes
-
^ These examples assume that the topological relationships among boundaries within each TIGER/Line version are accurate, which is reasonable given the essential priority given to topological accuracy throughout the history of the TIGER/Line program.
-
^ For a complete specification and assessment of cascading density weighting, see Chapter 3 in Schroeder (2009).
-
^ As in the 2000-2010 block interpolation model, we use the sum of population and housing units, rather than population or housing units alone, to guide 1990-2010 block interpolation. A model that uses total population alone as a guide would be problematic for interpolating counts of housing units in areas with large group-quarters populations (which do not reside in housing units) or large numbers of vacant housing units.
-
a b We restrict the area measurement to land area if the 2000 block includes any land area; otherwise, we use total area including water.
-
^ In cases where BO(z00), the estimated count of 2000 population and housing units, equals zero for an entire 1990 block, we use a balanced areal weighting model to generate interpolation weights. Balanced areal weighting uses balanced overlay to estimate areas of intersection between 1990 and 2010 blocks, restricting area measures to land areas in blocks that have land area. It then allocates 1990 counts to 2010 blocks in proportion to the estimated areas. The equation balancing IO and CDO areal weighting uses measures of α and β based on only 1990-2000 block relationships (α1 and β1) and not 2000-2010 block relationships (α2 and β2).
-
^ We restrict the area measurement to land area if the 1990 block includes any land area; otherwise, we use total area including water.
References
- ^ Schroeder, J. P. (2009). Visualizing patterns in US urban population trends (Doctoral dissertation, University of Minnesota).
- ^ Schroeder, J. P. (2017). "Hybrid areal interpolation of census counts from 2000 blocks to 2010 geographies." Computers, Environment and Urban Systems 62, 53-63. http://dx.doi.org/10.1016/j.compenvurbsys.2016.10.001